Market Report H2 2024

Real Estate Market at Full Strength Once Again, to the Benefit of Sellers

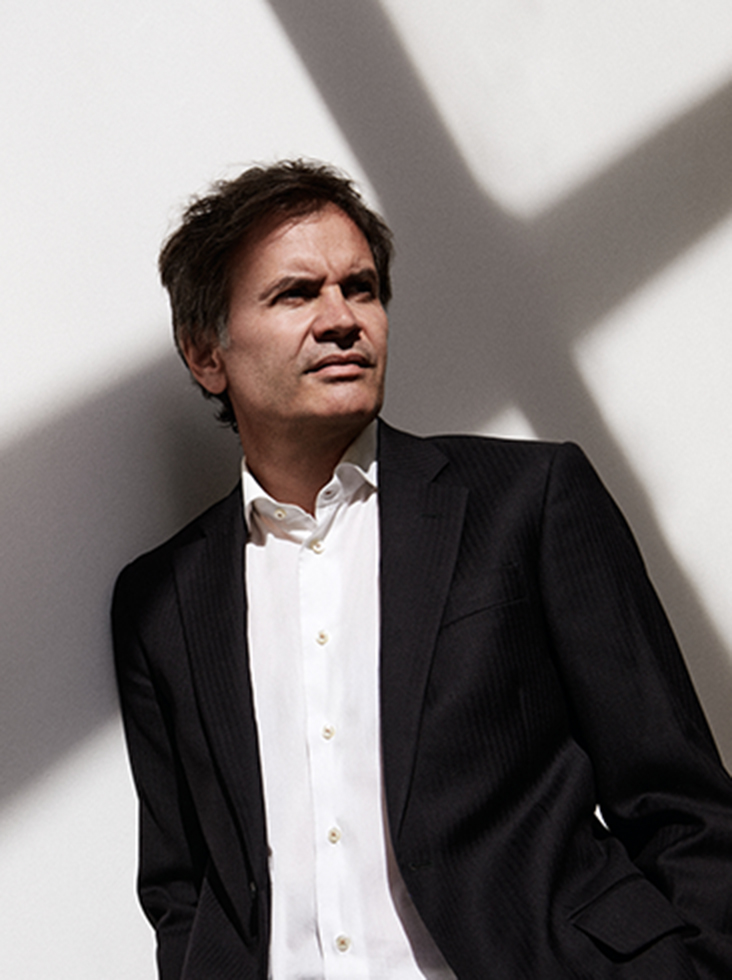
Prokop Svoboda

Owner of Svoboda & Williams

It’s a new year and therefore time to take stock of the recent past and try to predict what will happen in the near future. I’m happy to state that this January is full of optimism. In the final months of 2024, we witnessed a sharp increase in the volume of sales, which significantly exceeded our rather more cautious expectations from last January. In fact, the real estate market is once again in tip-top shape and barreling into the future at full strength and speed.

Investors are hungry and the stock of premium properties can no longer keep up with the high demand for them. This is especially true for the secondary property market in luxury real estate, while for new builds this product is virtually lacking. After a long break, it’s once again a seller’s market, meaning that real estate prices will increase at a more stable rate. In the half-year comparison, they rose on average by 5.4% and in the year-on-year comparison by 8.6% (H2 2024 vs. H2 2023).

At Svoboda & Williams, we’re convinced that the dynamic tempo of the market in the second half of 2024 will continue in the first half of 2025. We’re basing our optimistic outlook on the number of concluded reservation agreements, in which the growth in prices was already reflected. Prices this year will most likely decrease if interest rates go down and the predicted increase in construction material prices will have an impact on them.

With the renewed investment in real estate, capital markets are increasingly influenced by the sentiment of less experienced retail investors, which is accelerated by the rise of self-service apps. In the extremely fluid and changing environment of digital platforms, premium properties are a reliable fundamental with a very good return on capital. Since 2016, when Svoboda & Williams began to develop periodic market analyses, the average price of premium properties increased by 58%. These are the numbers that prove that home values are a solid foundation made of bricks that is wholly independent of the moods and feelings of mobile investment app users.


SAMPLE OF PROPERTIES MONITORED BY SVOBODA & WILLIAMS

7/2024–12/2024 vs. 1/2024–6/2024

  • CZK 167,761

    New builds and reconstructions, Ø per sq. m.

    Half-year change +4.6%

  • CZK 157,076

    Resales, Ø per sq. m.

    Half-year change +6.5%

  • CZK 40,105

    Rent per the Rental Price Index, per month

    Half-year change +1.6%

  • INCREASE IN INQUIRIES

    Half-year change

    H2 2024 vs. H1 2024 +0.7%

TRENDS IN PRAGUE’S PREMIUM PROPERTY MARKET

Based on the sample monitored by Svoboda & Williams

Sales

The market stepped into the new year at full strength. It’s showing dynamic growth in all  segments and in the second half of 2024 definitively surpassed pre-crisis values. Demand for premium properties has steadily increased and even broke the record previously held by 2021 in terms of yearly growth. The volume of realized transactions and the market value of the properties sold in Svoboda & Williams’ sample practically doubled in the half-year comparison.

The continuing strong demand and high volume of transactions have reduced the stock of quality properties and are putting pressure on prices. We see a more significant impact in the secondary market, where the average prices per m2 increased by 6.5% in the half-year comparison and year-on-year by an incredible 11%. The prices for new builds also went up, half-yearly by 4.6% and year-on-year 6.7%. Clients were most interested in one-bedroom and two-bedroom layouts.

The vast majority of buyers were domestic investors (81%). Most of our clients bought their properties with their own finds (68%). Last year, selling price per m2 records were broken. We sold several luxury apartments with prices of over CZK 400,000/m2, our largest transaction being on Pařížská Street, where the price was CZK 453,000/m2.

The reason behind this growth in prices is the deferred demand from 2022 and 2023 and the low housing stock available on the market. The anticipated further rise in prices is directly reflected in the price lists of newly offered residential projects.


Rentals

The rental market has remained stable: the prices of new rentals increased half-yearly by 1.6% and the average area of a rented property decreased by 2.2% to 88.3 m2. As in previous years, most transactions were for apartments in the wider center of Prague (63.4%). 

We noted the highest price hikes in the category of small apartments (studio to one-bedroom) in the wider center of Prague. Thanks to realized rental transactions for top-class properties in Prague 6, in terms of absolute value the average price for a rental apartment increased the most in this municipal district, specifically by CZK 9,500 in the half-year comparison. Conversely, the number of large expensive apartments in Prague 3 and 4 went down, leading to the decrease in the average rent in these locations. 

We’re also seeing a trend—the gradual movement of tenants of large apartments in the very center of Prague to more affordable rental properties in the wider city center.

Expat demand has remained stable in the half-year comparison. Although currently 66% of tenants are foreigners, their share of achieved transactions in the highest price segment (apartments over CZK 55,000/per month) decreased half-yearly by 8%. This is due to the continuing shrinking budgets of foreign companies for expat housing.


Price Analysis

The Prague residential market through the lens of Svoboda & Williams during the monitored period 7/2024–12/2024. The analysis is based on actually achieved sales transaction values.

Methodology of Data Processing

The analysis is based on data obtained from the database of properties offered by Svoboda & Williams during the monitored period (July 2024–December 2024). Sales transactions were supplemented with data on sales of new builds with parameters that match Svoboda & Williams’ portfolio (in this case, the achieved prices were obtained from the Cadastre of Real Estate). The sample monitored by Svoboda & Williams contains nearly 250 sold and 500 rented properties over a 6-month period and therefore covers a significant portion of the premium segment of the Prague residential market. 

The monitored properties are apartments in Prague 1–10; other municipal districts are minimally represented. Within each district, most of the properties in the sample are in premium locations with higher achieved prices such as Bubeneč, Dejvice, Střešovice, and Břevnov in Prague 6, Pankrác, Vyšehrad, and Podolí in Prague 4, Karlín and parts of Libeň in Prague 8, Smíchov in Prague 5, etc. The monitored property prices and rents are actually achieved transactions; we don’t monitor advertised prices. To calculate the price per sq. m., we take into account the price for parking spaces, which we deduct from the achieved sales price and we also include a proportional part of the exterior (terraces, balconies, loggias, and gardens) in the floor area of the apartment (according to the Civil Code). To recalculate the exterior area, we apply a specially developed algorithm that progressively reduces this area and takes into account the ratio of the exterior to the interior area. Average prices are calculated from the transactions finalized over the last 6 months (7/2024–12/2024); percentage changes are half year (7/2024–12/2024 vs. 1/2024–6/2024). For sales, we also determine the price per sq. m. for two categories: new builds (new apartments in residential projects, completely reconstructed apartment buildings, or loft conversions) and resales (secondhand apartments). The prices of new apartments in residential developments are listed including VAT. In order to be able to compare the prices per sq. m. for all apartments, we unified the stage of construction progress for several units using an average assumption of CZK 50,000/sq. m. for the stage prior to reconstruction (shell & core) and CZK 20,000/sq. m. for the stage before the completion of surfaces (white walls). We don’t monitor the price per sq. m. for rentals. While the price per sq. m. is relevant for sales, for rentals the price is determined mainly by layout in addition to location. For example, a one-bedroom apartment with a 50 sq. m. floor area is normally rented for the same price as an apartment with the same layout with a floor area of 60 sq. m., whereas the purchase price of a larger apartment can be up to 15 to 20% higher. Therefore, in our analyses of residential rentals we work with the total rent, and not with the price per sq. m. For a better picture, we also state the achieved price for the most frequent layouts in the sales and rental transactions realized by Svoboda & Williams, i.e., one-bedroom and two-bedroom apartments. 

Data analysis

Methodology of Svoboda & Williams

Ne

Listed price

Ano

Achieved price

Price per sq. m =
Achieved sales price - price of parking Apartment area + proportional part of the exterior (b/t/g)

Algorithm for conversion of the exterior

The area of a terrace that exceeds 30% of the interior is divided by two.

The analysis is based on data obtained from the database of properties offered by Svoboda & Williams in the monitored period. We supplement the sales transactions with sales data from the land register with similar parameters to our sample. We monitor the value of achieved transactions, not offer prices.

The selected methodology is one of the most precise analytical tools on the market. To calculate the price per sq. m., we take into account the ratio of the exterior to the interior, the standard of the property's facilities, and the price for parking is deducted from the achieved sales price. Additional information can be found in the Data Processing Methodology section.

OVERALL SUMMARY

during the monitored period 7/2024–12/2024

Average prices during the monitored period (7/2024–12/2024) and their half-year change (compared to 1/2024–6/2024)

Ø Apt. price* Ø Price per sq. m. Ø Apt. size Ø Price per sq. m.
New apt.** Resale apt.
Sales CZK 13,370,121 CZK 164,977 81.0 sq. m. CZK 167,761 CZK 157,076
-0.5% 5.4% -5.7% 4.6% 6.5%
Rentals CZK 40,105 N/A 88.3 sq. m. N/A N/A
1.6% N/A -2.2% N/A N/A

Source: data of Svoboda & Williams | *all layouts | **new builds and reconstructions

Average achieved rents vs. sales prices for specific layouts in Prague 1–10 in the monitored period (7/2024–12/2024)

Layout Ø Monthly rent Rentals Ø apt. floor space Ø Selling price Sales Ø apt. floor space
studio CZK 20,593 38.7 sq. m. CZK 5,987,937 36.8 sq. m.
1bdrm CZK 30,058 61.9 sq. m. CZK 9,118,927 57.7 sq. m.
2bdrm CZK 44,809 98.4 sq. m. CZK 15,662,400 99.3 sq. m.
3bdrm CZK 65,240 147.5 sq. m. CZK 21,120,475 134.1 sq. m.
4bdrm CZK 80,188 209.4 sq. m. CZK 34,459,899 204.7 sq. m.

Source: data of Svoboda & Williams

SALE

Average achieved rents vs. sales prices for specific layouts in Prague 1-10 (7/2024–12/2024)

Municipal district Ø Apt. price Ø Price per sq. m. Ø Apt. size
Prague 1 CZK 22,258,296 CZK 242,332 91.9 sq. m.
Prague 2 CZK 15,707,011 CZK 173,746 90.4 sq. m.
Prague 3 CZK 10,353,777 CZK 146,380 70.7 sq. m.
Prague 4 CZK 12,372,881 CZK 169,304 73.2 sq. m.
Prague 5 CZK 12,356,456 CZK 147,517 83.8 sq. m.
Prague 6 CZK 13,599,151 CZK 146,965 92.5 sq. m.
Prague 7 CZK 13,555,000 CZK 167,220 81.1 sq. m.
Prague 8 CZK 15,126,429 CZK 164,186 92.1 sq. m.
Prague 9 CZK 7,065,000 CZK 112,860 62.6 sq. m.
Prague 10 CZK 8,458,436 CZK 137,358 61.6 sq. m.

Source: data of Svoboda & Williams

Development of the average achieved sales price per sq. m. in the segment monitored by Svoboda & Williams (in CZK)

Buyer Segmentation

Ratio of Czech and foreign buyers

81% Czechs
19% Foreigners

Financing the purchase of property

68% Own funds
32% Mortgage loans

Sales per layout

11.5% studio
43.9% 1bdrm
27% 2bdrm
11.5% 3bdrm
6.1% 4bdrm and larger

RENTALS

Overall summary of average achieved rental prices in municipal districts (7/2024–12/2024)

Municipal district Ø Monthly rent Ø Apt. floor space Ø Monthly rent 1bdrm Ø Monthly rent 2bdrm
Prague 1 CZK 50,369 107.7 sq. m. CZK 34,168 CZK 52,122
Prague 2 CZK 42,275 97.2 sq. m. CZK 27,842 CZK 43,280
Prague 3 CZK 30,498 64.2 sq. m. CZK 26,096 CZK 34,526
Prague 4 CZK 29,136 80.2 sq. m. CZK 26,643 CZK 33,429
Prague 5 CZK 36,822 82.6 sq. m. CZK 29,931 CZK 40,421
Prague 6 CZK 48,102 108.1 sq. m. CZK 29,321 CZK 41,714
Prague 7 CZK 32,339 78.9 sq. m. CZK 27,718 CZK 46,500
Prague 8 CZK 42,955 79.1 sq. m. CZK 34,478 CZK 53,083
Prague 9 CZK 29,256 76.1 sq. m. CZK 24,950 CZK 32,667
Prague 10 CZK 36,667 87.5 sq. m. CZK 24,667 CZK 39,833

Source: data of Svoboda & Williams

Tenant Segmentation

Ratio of Czech and foreign clients inquiring about a property

48% Czechs
52% Foreigners

Ratio of clients who rented a property

34% Czechs
66% Foreigners

Rents per layout

10% studio
42.5% 1bdrm
30.1% 2bdrm
12.4% 3bdrm
5% 4bdrm and larger

Overview of rental price segments–rental inquiries vs. realized rental transactions

Price segments Inquiries - Czechs Inquiries - Foreigners Realized rental transactions - Czechs Realized rental transactions - Foreigners
CZK < 25 thous. 46% 54% 39% 61%
CZK 25-55 thous. 49% 51% 33% 67%
CZK > 55 thous. 51% 49% 28% 72%
Total 48% 52% 34% 66%

Source: data of Svoboda & Williams

Rental price index

An analytical tool developed in cooperation with the University of Economics in Prague that provides a more detailed view of the change in the prices.

METHODOLOGY OF DATA PROCESSING

WHAT IS THE RENTAL PRICE INDEX BY SVOBODA & WILLIAMS + VŠE?

The Rental Price Index by S&W + VŠE is an analytical tool that monitors the growth of rental prices in the premium segment in Prague developed by the Svoboda & Williams real estate agency in cooperation with the Faculty of Informatics and Statistics of the University of Economics in Prague. The data is sourced from the actually achieved rents of the apartments that were listed by Svoboda & Williams. Annually, it amounts to 1,200 properties in the territory of Prague 1–10 with studio to 5-bedroom layouts. Since the properties exhibit a high level heterogeneity, we apply an aggregate price index to the development of their prices. It works just like the Consumer Price Index maintained by the Czech Statistical Office, which measures inflation.


WHY SIMPLY COMPARING THE AVERAGE PRICE DEVELOPMENT IS NOT ENOUGH?

The development of average rental prices doesn’t correctly reflect the actual change in prices. This is because the average rent is influenced not only by fluctuations in prices, but also by a changed product structure. Let’s give an example. In two monitored periods, a sample of apartments including luxury apartments in the center of Prague and cheaper apartments in the broader center have been rented. The prices of both the cheaper and the luxury apartments in the second period remain equal, but more of the expensive units have been rented. This will raise average rents, but the price index will remain the same. The aggregate price index is based on the assumption of the fixed presence of rental segments in the portfolio and therefore reflects the change in price, which is “cleaned” of the change in the rental structure. The index is calculated as a weighted average of the price changes in the individual segments, where the weights are their representation in the portfolio (structure) in the selected fixed period.


CONSTRUCTION OF THE RENTAL PRICE INDEX BY SVOBODA & WILLIAMS + VŠE


Selection of segments

The segmentation made sure that the apartments in the same group were as similar as possible and, on the other hand, that the groups were as different as possible. At the same time, each group had to contain a sufficient amount of data. Within the statistical analysis, the impact of many factors on rental prices was examined. These parameters included the specific layout of an apartment, its location, floor, and whether it came with a terrace, balcony, or loggia, or the option to rent a parking space. The analysis proved that rents were most affected by the location and layout of the apartment, and therefore we performed the segmentation based on these two factors.

Based on our expertise and the data analysis of rental prices, we divided Prague into three locations—the center, the wider center, and the rest of Prague (see map above).

Apartment layouts were chosen as the second factor. Based on the location and the layout we defined 9 segments in total: studio to one-bedroom, two-bedroom, and three-bedroom and larger in the Center, Wider center, and Rest of Prague.


Selection of weights

We assigned weights to the individual segments on the basis of the structure of the apartments rented during the calendar year of 2016. The weight of a segment in the price index is calculated as a proportion of the total rent in the relevant segment to the total rent for all segments brokered in 2016. 

The index is compiled on a biannual basis to ensure that a sufficient number of observations could be made. In practice, biannual indexes aren’t as common as monthly or quarterly indexes, but they’re by no means exceptional. For example, the United States Department of Labor uses one to construct the consumer price index.


We calculate two kinds of indexes

A year-on-year index  – monitors the rental price changes between the current half-year period and the previous half-year period (e.g. H2 2023 vs. H1 2023)

A base index – monitors the rental price changes between the current and the so-called base period. A stable period considered a long-term “normal” default should be selected as a base period, in our case H1 2015.

The source of the data is the actual rental prices achieved by Svoboda & Williams, constituting approximately 1,200 properties per year in Prague 1–10 with layouts ranging from studios to 5-bedrooms. Since these prices vary widely, we apply an aggregate price index to their development over time. It works similarly to the consumer price index of the Czech Statistical Office.

ACHIEVED RENTS FOR PREMIUM APARTMENTS IN PRAGUE

H2 2024 (July 2024–December 2024)

CZK 40,105

Average achieved rents in the monitored period (July 2024–December 2024) in Prague

+1.6%

Change in the semi-annual index compared to the previous period (January 2024–June 2024)

The Rental Price Index tracks the change in the average achieved rental price for an apartment in Prague offered by Svoboda & Williams for the monitored period (July 2024–December 2024) compared to the second half of the previous year (January 2024–June 2024). This is an aggregate price index, which is calculated as a weighted average of changes in rental prices for individual apartment categories.

Development of achieved rents for apartments in the segment monitored by Svoboda & Williams (2015 H1 = 100).

Achieved apartment rents in H2 2024 per segment and half-year changes

Segment Center Wider center Rest of Prague
Studio to 1bdrm CZK 29,437 4.5% CZK 28,521 8.3% CZK 22,934 -2.4%
2bdrm CZK 46,083 -2.4% CZK 46,031 7.5% CZK 31,187 -2.6%
3bdrm and larger CZK 72,778 -5.1% CZK 72,172 7.2% CZK 46,909 1.2%

Source: data of Svoboda & Williams

Relative representation in the portfolio

Segment Center Wider center Rest of Prague
Studio to 1bdrm 10.1% 36.6% 5.9%
2bdrm 11.9% 15.2% 3%
3bdrm and larger 5.7% 9.3% 2.2%

Note. Apartments with 6-bedroom layouts and larger are represented too sparsely and are not included in the analysis.

Prague 1 Prague 2 Prague 6 Prague 5 Prague 4 Prague 3 Prague 7 Prague 8 Prague 9 Prague 10
  • Center
  • Wider center
  • Rest of Prague

Prague Office Market

H2 2024

Current trends in the commercial leasing market

3.9 mil. sq. m.

Total volume of office space in Prague

8.1%

Vacancy rate

30 EUR/sq. m./month

Prime rent in the city center

The trend of the first half of 2024 continued into the second half and the market remains a mostly renegotiation one. Companies prefer to renegotiate rental agreements rather than moving. Nevertheless, Svoboda & Williams’ consultants have managed to acquire tenants in quality new buildings such as the Rohan or Port7 projects, where we brokered the lease of almost 8,000 m2 for several clients in the last 18 months. We also perceive the pressure that companies place on their employees to return to working in the office five days per week, which we believe will have a positive effect on the robustness of the market this year. Interest in sustainable and effective projects that place great importance on ESG aspects is growing. Energy effectiveness, sustainable building processes, lowering carbon footprints—this trend will continue well into the future. Although over 160,000 m2 of new office space is being built in Prague right now, most will be completed in 2027. The office stock, especially in the very center of the city, will remain limited in the months to come, which can lead to a further increase in rents


Jaroslav Waldhauser 
Head of Commercial Leasing at Svoboda & Williams 

TOTAL VOLUME OF FLEXIBLE OFFICE SPACE IN PRAGUE

133,531 sq. m.

In the second half of 2024 in Prague, 5,300 m² were added to the offer of shared offices, i.e. almost 10,000 m² of new office space for the entire year. Though the level of growth is lower than in 2023, the operators of shared offices have ambitious plans for expansion in 2025.

The international IWG provider, which stands behind the brands Regus and SPACES., has newly taken over OFFY in the Pankrác Prime building. For 2025, IWG is planning to open a new center in the Lighthouse Waterfront Tower building in Prague’s Holešovice neighborhood, fulfilling its desire to create a firm foundation for further expansion in the Czech market.

The largest local operator, Scott.Weber, is continuing in its expansion plans and has achieved results. In 2024, the company extended its current branches in the Churchill (Prague 2) and DOCK (Prague 8) buildings. In 2025, it’s planning to open in a new location in the popular Karlín neighborhood, specifically in the PernerKa building.

Moreover, Scott.Weber is preparing to expand outside of Prague’s city limits. In May 2025, it will open a 4,400 m² center in Ostrava in the Organica building. It will open in other cities and towns in 2027, when it will unveil a new center in Brno, in the Dornych project, with a floor space of 5,400 m².

Flexible and shared offices are no longer the domain of startups. Today, they’re part of the key development strategy of most companies. Prague remains a strong market, but shared offices are gradually expanding into other regional cities. Smaller companies and larger corporations alike are searching for solutions to keep them competitive during times of change and adapt to hybrid work trends. It’s not just the space itself that’s important to them, but the creation of a work environment that supports productivity and offers much-needed flexibility.

PRAGUE'S SHARED OFFICE MARKET

Percent of operators' market share

SHARED OFFICE MARKET IN PRAGUE

Ratio of local to international providers

72.76% Local
27.24% International
  • Local: Offices Unlimited, Scott.Weber, FLEKSI, FLEXI OFFICE, Impact Hub, Opero, WorkLounge, mo-cha, Business Centrum Smíchov, Zenwork
  • International: IWG (Spaces + Regus), WeWork, mycowork Palmovka