Market Report H1 2024

Bespoke Real Estate Services and Quality Properties Are Key Factors in the Post-Crisis Market

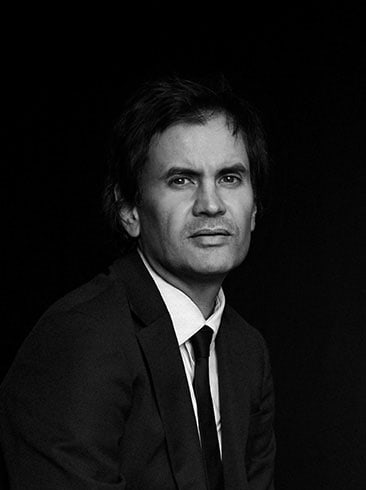
Prokop Svoboda

Owner of Svoboda & Williams

With the summer holiday season upon us, we once again bring you our up-to-date analysis of the domestic premium property market. This year’s heat wave is made more bearable by a promising outlook of the future—after seemingly interminable months of economic recession, the real estate business is finally warming up. What opportunities and trends has Svoboda & Williams identified in the post-crisis market?

The last two years saw many challenges, but there were also many opportunities. The cultivation of our business was undoubtedly one of the positive impacts of the downturn we all experienced. During the economic crisis, clients became acutely aware that the services provided by the most experienced realtors can spell success in a cooling market. Our personal approach to each client and high level of professionalism allowed us to deepen our relationships and strengthen the trust that people placed in us.

Since the autumn of 2023, we’ve witnessed the gradual recovery of the market: demand, transaction volumes, and property prices, all of which Svoboda & Williams monitors, have shown steady growth. Our analysis reveals that in the first half year of 2024 interest in exclusive apartments with spacious floor areas increased significantly. We’ve also seen record-breaking sales prices for the most exceptional properties in our portfolio.

Therefore, I have no doubt that top quality real estate will continue to be a profitable investment opportunity with great potential due to the further growth in prices. Premium property prices haven’t yet fully absorbed the higher construction costs caused by the recent crisis. Quality, whether in terms of technologies or craftsmanship, should be a key factor for investors in the current market. It’s of vital importance, however, that they evaluate these aspects correctly.

Residential real estate is becoming a premium asset for the middle class as well as an asset that can be passed down from generation to generation. As long as the population of Prague continues to grow by tens of thousands of new residents every year and only several thousand apartments are added to the market, the hunger for housing will never be sated. The low stock of housing for sale that people can hold in private ownership is putting pressure on the rental market, which will likely encourage calls for the state to roll out a stimulus package. In my opinion, a step in the right direction would and should be a VAT deduction for rental housing investors.


SAMPLE OF PROPERTIES MONITORED BY SVOBODA & WILLIAMS

1/2024–6/2024 vs. 7/2023–12/2023

  • CZK 160,421

    New builds and reconstructions, Ø per sq. m.

    Half-year change +2.0%

  • CZK 147,536

    Resales, Ø per sq. m.

    Half-year change +4.5%

  • CZK 39,465

    Rent per the Rental Price Index, per month

    Half-year change +1.0%

  • INCREASE IN INQUIRIES

    Half-year change

    H1 2024 vs. H2 2023 +36.0%

TRENDS IN PRAGUE’S PREMIUM PROPERTY MARKET

Based on the sample monitored by Svoboda & Williams

Sales

The market has finally recovered from the previous short period of stagnation and has shown steady growth in all segments since the beginning of the year. Demand in the first half of 2024 increased by 36%, the volume of achieved transactions in Svoboda & Williams’ sample rose by 17%, and the market value of the properties sold was 23% higher compared to the previous half-year.

The Czech National Bank’s expansive monetary policy acted as an accelerant for the mortgage market. According to data from the Czech Banking Association, the volume of new mortgages approved in June was almost double the amount seen in January 2024. At Svoboda & Williams, 39% of all buyers used mortgages to finance the purchase of property, a 4% half-year increase. 

The increase in the average price per m2 of an apartment in Prague was more or less gradual, rising by only 3%. Although the growth in resale prices was higher (4.5%), the price tag for new builds, driven by high-end residential projects, in some cases broke previously set sales records. In short, the limit of CZK 160,000/m2 for an average new build in the sample monitored by Svoboda & Williams was exceeded. Apartment prices rose continuously regardless of layout, with the exception of studio units, the prices of which were stagnant. 

The biggest increase was in clients’ interest in exclusive apartments with sprawling floor areas and two-bedroom, three-bedroom, and four-bedroom layouts—a half-year growth of 40%.

Rentals

The rental market remains stable: average rental prices are up by 1% in the half-year comparison and the average area of a rental apartment is still around 90.2 m2. Most rental transactions were properties located in the wider center of Prague (62%), a trend that continues into this half-year. 

The Prague market has welcomed a greater number of successful rental projects, which generate significant hikes in rental prices in their location and segment. An example of this is Lihovar in Prague 5 or Fragment in Prague 8. Similarly, in the narrower center of Prague, rents for two-bedroom apartments increased by up to 20% thanks to achieved rental transactions for superior apartments.

After a short-lived downturn in the rental market, we are already seeing a rising number of expat renters. The number of Czech tenants decreased by 6% compared to the previous period. Currently, 65% of tenants are foreigners and in the highest price bracket (apartments that go for over CZK 55,000/month) the figure is up to 80%


Price Analysis

The Prague residential market through the lens of Svoboda & Williams during the monitored period 1/2024–6/2024. The analysis is based on actually achieved sales transaction values.

Methodology of Data Processing

The analysis is based on data obtained from the database of properties offered by Svoboda & Williams during the monitored period (January 2024–June 2024). Sales transactions were supplemented with data on sales of new builds with parameters that match Svoboda & Williams’ portfolio (in this case, the achieved prices were obtained from the Cadastre of Real Estate). The sample monitored by Svoboda & Williams contains nearly 250 sold and 500 rented properties over a 6-month period and therefore covers a significant portion of the premium segment of the Prague residential market. 

The monitored properties are apartments in Prague 1–10; other municipal districts are minimally represented. Within each district, most of the properties in the sample are in premium locations with higher achieved prices such as Bubeneč, Dejvice, Střešovice, and Břevnov in Prague 6, Pankrác, Vyšehrad, and Podolí in Prague 4, Karlín and parts of Libeň in Prague 8, Smíchov in Prague 5, etc. The monitored property prices and rents are actually achieved transactions; we don’t monitor advertised prices. To calculate the price per sq. m., we take into account the price for parking spaces, which we deduct from the achieved sales price and we also include a proportional part of the exterior (terraces, balconies, loggias, and gardens) in the floor area of the apartment (according to the Civil Code). To recalculate the exterior area, we apply a specially developed algorithm that progressively reduces this area and takes into account the ratio of the exterior to the interior area. Average prices are calculated from the transactions finalized over the last 6 months (1/2024–6/2024); percentage changes are half year (1/2024–6/2024 vs. 7/2023–12/2023). For sales, we also determine the price per sq. m. for two categories: new builds (new apartments in residential projects, completely reconstructed apartment buildings, or loft conversions) and resales (secondhand apartments). The prices of new apartments in residential developments are listed including VAT. In order to be able to compare the prices per sq. m. for all apartments, we unified the stage of construction progress for several units using an average assumption of CZK 50,000/sq. m. for the stage prior to reconstruction (shell & core) and CZK 20,000/sq. m. for the stage before the completion of surfaces (white walls). We don’t monitor the price per sq. m. for rentals. While the price per sq. m. is relevant for sales, for rentals the price is determined mainly by layout in addition to location. For example, a one-bedroom apartment with a 50 sq. m. floor area is normally rented for the same price as an apartment with the same layout with a floor area of 60 sq. m., whereas the purchase price of a larger apartment can be up to 15 to 20% higher. Therefore, in our analyses of residential rentals we work with the total rent, and not with the price per sq. m. For a better picture, we also state the achieved price for the most frequent layouts in the sales and rental transactions realized by Svoboda & Williams, i.e., one-bedroom and two-bedroom apartments. 

Data analysis

Methodology of Svoboda & Williams

Ne

Listed price

Ano

Achieved price

Price per sq. m =
Achieved sales price - price of parking Apartment area + proportional part of the exterior (b/t/g)

Algorithm for conversion of the exterior

The area of a terrace that exceeds 30% of the interior is divided by two.

The analysis is based on data obtained from the database of properties offered by Svoboda & Williams in the monitored period. We supplement the sales transactions with sales data from the land register with similar parameters to our sample. We monitor the value of achieved transactions, not offer prices.

The selected methodology is one of the most precise analytical tools on the market. To calculate the price per sq. m., we take into account the ratio of the exterior to the interior, the standard of the property's facilities, and the price for parking is deducted from the achieved sales price. Additional information can be found in the Data Processing Methodology section.

OVERALL SUMMARY

during the monitored period 1/2024–6/2024

Average prices during the monitored period (1/2024–6/2024) and their half-year change (compared to 7/2023–12/2023)

Ø Apt. price* Ø Price per sq. m. Ø Apt. size Ø Price per sq. m.
New apt.** Resale apt.
Sales CZK 13,436,972 CZK 156,482 85.9 sq. m. CZK 160,421 CZK 147,536
3.8% 3.0% 0.8% 2.0% 4.5%
Rentals CZK 39,465 N/A 90.2 sq. m. N/A N/A
1.0% N/A 0.7% N/A N/A

Source: data of Svoboda & Williams | *all layouts | **new builds and reconstructions

Average Achieved Rents vs. Sales Prices for Specific Layouts in Prague 1–10 in the Monitored Period (1/2024–6/2024)

Layout Ø Monthly rent Rentals Ø apt. floor space Ø Selling price Sales Ø apt. floor space
studio CZK 20,939 37.8 sq. m. CZK 5,509,640 35.5 sq. m.
1bdrm CZK 28,880 63.5 sq. m. CZK 9,421,299 62.0 sq. m.
2bdrm CZK 43,439 104.8 sq. m. CZK 15,155,079 99.7 sq. m.
3bdrm CZK 62,510 146.9 sq. m. CZK 20,415,444 136.3 sq. m.
4bdrm CZK 84,730 208.0 sq. m. CZK 40,426,821 204.0 sq. m.

Source: data of Svoboda & Williams

SALE

Average achieved rents vs. sales prices for specific layouts in Prague 1-10 (1/2024–6/2024)

Municipal district Ø Apt. price Ø Price per sq. m. Ø Apt. size
Prague 1 CZK 21,292,500 CZK 218,834 97.3 sq. m.
Prague 2 CZK 17,205,897 CZK 166,826 103.1 sq. m.
Prague 3 CZK 9,889,198 CZK 145,982 67.7 sq. m.
Prague 4 CZK 11,860,688 CZK 136,049 87.2 sq. m.
Prague 5 CZK 13,748,531 CZK 148,058 92.9 sq. m.
Prague 6 CZK 16,254,671 CZK 191,713 84.8 sq. m.
Prague 7 CZK 12,517,500 CZK 155,741 80.4 sq. m.
Prague 8 CZK 15,855,234 CZK 157,824 100.5 sq. m.
Prague 9 CZK 8,271,358 CZK 112,936 73.2 sq. m.
Prague 10 CZK 9,426,440 CZK 136,487 69.1 sq. m.

Source: data of Svoboda & Williams

Development of the average achieved sales price per sq. m. in the segment monitored by Svoboda & Williams (in CZK)

Buyer Segmentation

Ratio of Czech and foreign buyers

78% Czechs
22% Foreigners

Financing the purchase of property

61% Own funds
39% Mortgage loans

Sales per layout

19.7% studio
34.1% 1bdrm
24.5% 2bdrm
16.8% 3bdrm
4.8% 4bdrm and larger

RENTALS

Overall summary of average achieved rental prices in municipal districts (1/2024–6/2024)

Municipal district Ø Monthly rent Ø Apt. floor space Ø Monthly rent 1bdrm Ø Monthly rent 2bdrm
Prague 1 CZK 48,322 107.9 sq. m. CZK 32,821 CZK 51,553
Prague 2 CZK 42,656 98.6 sq. m. CZK 27,737 CZK 45,328
Prague 3 CZK 34,352 83.5 sq. m. CZK 27,482 CZK 39,757
Prague 4 CZK 35,375 112.3 sq. m. CZK 23,000 CZK 39,250
Prague 5 CZK 36,205 82.6 sq. m. CZK 27,790 CZK 38,963
Prague 6 CZK 38,903 89.7 sq. m. CZK 27,443 CZK 36,318
Prague 7 CZK 34,274 84.5 sq. m. CZK 26,778 CZK 40,408
Prague 8 CZK 42,431 81.3 sq. m. CZK 33,433 CZK 48,907
Prague 9 CZK 24,857 69.9 sq. m. CZK 23,000 CZK 32,300
Prague 10 CZK 36,322 96.8 sq. m. CZK 27,156 CZK 36,760

Source: data of Svoboda & Williams

Tenant Segmentation

Ratio of Czech and foreign clients inquiring about a property

48% Czechs
52% Foreigners

Ratio of clients who rented a property

35% Czechs
65% Foreigners

Rents per layout

13.4% studio
36.0% 1bdrm
32.0% 2bdrm
14.1% 3bdrm
4.5% 4bdrm and larger

Overview of rental price segments–rental inquiries vs. realized rental transactions

Price segments Inquiries - Czechs Inquiries - Foreigners Realized rental transactions - Czechs Realized rental transactions - Foreigners
CZK < 25 thous. 47% 53% 40% 60%
CZK 25-55 thous. 50% 50% 39% 61%
CZK > 55 thous. 45% 55% 20% 80%
Total 48% 52% 35% 65%

Source: data of Svoboda & Williams

Rental price index

An analytical tool developed in cooperation with the University of Economics in Prague that provides a more detailed view of the change in the prices.

METHODOLOGY OF DATA PROCESSING

WHAT IS THE RENTAL PRICE INDEX BY SVOBODA & WILLIAMS + VŠE?

The Rental Price Index by S&W + VŠE is an analytical tool that monitors the growth of rental prices in the premium segment in Prague developed by the Svoboda & Williams real estate agency in cooperation with the Faculty of Informatics and Statistics of the University of Economics in Prague. The data is sourced from the actually achieved rents of the apartments that were listed by Svoboda & Williams. Annually, it amounts to 1,200 properties in the territory of Prague 1–10 with studio to 5-bedroom layouts. Since the properties exhibit a high level heterogeneity, we apply an aggregate price index to the development of their prices. It works just like the Consumer Price Index maintained by the Czech Statistical Office, which measures inflation.


WHY SIMPLY COMPARING THE AVERAGE PRICE DEVELOPMENT IS NOT ENOUGH?

The development of average rental prices doesn’t correctly reflect the actual change in prices. This is because the average rent is influenced not only by fluctuations in prices, but also by a changed product structure. Let’s give an example. In two monitored periods, a sample of apartments including luxury apartments in the center of Prague and cheaper apartments in the broader center have been rented. The prices of both the cheaper and the luxury apartments in the second period remain equal, but more of the expensive units have been rented. This will raise average rents, but the price index will remain the same. The aggregate price index is based on the assumption of the fixed presence of rental segments in the portfolio and therefore reflects the change in price, which is “cleaned” of the change in the rental structure. The index is calculated as a weighted average of the price changes in the individual segments, where the weights are their representation in the portfolio (structure) in the selected fixed period.


CONSTRUCTION OF THE RENTAL PRICE INDEX BY SVOBODA & WILLIAMS + VŠE


Selection of segments

The segmentation made sure that the apartments in the same group were as similar as possible and, on the other hand, that the groups were as different as possible. At the same time, each group had to contain a sufficient amount of data. Within the statistical analysis, the impact of many factors on rental prices was examined. These parameters included the specific layout of an apartment, its location, floor, and whether it came with a terrace, balcony, or loggia, or the option to rent a parking space. The analysis proved that rents were most affected by the location and layout of the apartment, and therefore we performed the segmentation based on these two factors.

Based on our expertise and the data analysis of rental prices, we divided Prague into three locations—the center, the wider center, and the rest of Prague (see map above).

Apartment layouts were chosen as the second factor. Based on the location and the layout we defined 9 segments in total: studio to one-bedroom, two-bedroom, and three-bedroom and larger in the Center, Wider center, and Rest of Prague.


Selection of weights

We assigned weights to the individual segments on the basis of the structure of the apartments rented during the calendar year of 2016. The weight of a segment in the price index is calculated as a proportion of the total rent in the relevant segment to the total rent for all segments brokered in 2016. 

The index is compiled on a biannual basis to ensure that a sufficient number of observations could be made. In practice, biannual indexes aren’t as common as monthly or quarterly indexes, but they’re by no means exceptional. For example, the United States Department of Labor uses one to construct the consumer price index.


We calculate two kinds of indexes

A year-on-year index  – monitors the rental price changes between the current half-year period and the previous half-year period (e.g. H2 2023 vs. H1 2023)

A base index – monitors the rental price changes between the current and the so-called base period. A stable period considered a long-term “normal” default should be selected as a base period, in our case H1 2015.

The source of the data is the actual rental prices achieved by Svoboda & Williams, constituting approximately 1,200 properties per year in Prague 1–10 with layouts ranging from studios to 5-bedrooms. Since these prices vary widely, we apply an aggregate price index to their development over time. It works similarly to the consumer price index of the Czech Statistical Office.

ACHIEVED RENTS FOR PREMIUM APARTMENTS IN PRAGUE

H1 2024 (January 2024–June 2024)

CZK 39,465

Average achieved rents in the monitored period (January 2024–June 2024) in Prague

+1.0 %

Change in the semi-annual index compared to the previous period (January 2024–June 2024)

The Rental Price Index tracks the change in the average achieved rental price for an apartment in Prague offered by Svoboda & Williams for the monitored period (January 2024–June 2024) compared to the second half of the previous year (July 2023–December 2023). This is an aggregate price index, which is calculated as a weighted average of changes in rental prices for individual apartment categories.

Development of achieved rents for apartments in the segment monitored by Svoboda & Williams (2015 H1 = 100).

Achieved apartment rents in H1 2024 per segment and half-year changes

Segment Centre Wider center Rest of Prague
Studio to 1bdrm CZK 28,166 -4.6% CZK 26,336 -2.9% CZK 23,504 12.4%
2bdrm CZK 47,202 19.7% CZK 42,810 -1.3% CZK 32,024 1.8%
3bdrm and larger CZK 76,673 -0.2% CZK 67,319 2.2% CZK 46,333 -3.3%

Source: data of Svoboda & Williams

Relative representation in the portfolio

Segment Centre Wider centre Rest of Prague
Studio to 1bdrm 10.2% 33.2% 5.5%
2bdrm 11.2% 16.9% 4.3%
3bdrm and larger 4.7% 12.2% 1.8%

Note. Apartments with 6-bedroom layouts and larger are represented too sparsely and are not included in the analysis.

Prague 1 Prague 2 Prague 6 Prague 5 Prague 4 Prague 3 Prague 7 Prague 8 Prague 9 Prague 10
  • Center
  • Wider center
  • Rest of Prague

Shared offices

H1 2024

Current trends in the commercial leasing market

3.9 mil. sq. m.

Total volume of office space in Prague

Several factors have shaped the commercial leasing market in the first half of 2024: expensive fit-out construction costs, a lack of new office projects of adequate size and parameters, and the slow movement of tenants (in the post-covid labor market, the home office has become a permanent fixture). This has had a chilling effect on the market—in recent months the highest activity has been in renegotiations, i.e. companies preferring to renegotiate leases rather than move. Demand for subleases is also growing. Nevertheless, in this reduced and undersaturated market, whenever a quality office project appears in a good location, tenant interest is extremely high.

Jaroslav Waldhauser 
Head of Commercial Leasing at Svoboda & Williams 

TOTAL VOLUME OF FLEXIBLE OFFICE SPACE IN PRAGUE

128,215 sq. m.

Compared to the previous half-year, the expansion of the shared office market in Prague has slowed significantly. Over the course of the previous six months, 4,196 m² of flexible office space was added in the city, down by almost two thirds. Nevertheless, there were two interesting new developments. In the first half of 2024, the OFFY provider opened for business in the Pankrác Prime building in Prague 4 and in the Business Centrum in Smíchov.

Offices Unlimited also expanded, adding a new location in the beginning of 2024, its fifth to date. The exclusive boutique Na Zátorce by Svoboda & Williams coworking space, situated in a premium Art Nouveau villa in a residential area in Prague 6, took just a few short weeks to come to full occupancy. In 2024, Offices Unlimited is planning to add Worklounge to its portfolio, with shared offices in Žižkov and Dejvice.

PRAGUE'S SHARED OFFICE MARKET

Percent of operators' market share

SHARED OFFICE MARKET IN PRAGUE

Ratio of local to international providers

72.48% Local
27.52% International
  • Local: Offices Unlimited, Scott.Weber, Fleksi, Flexi Offices, Impact Hub, Opero, WorkLounge, Base4Work, Mo-Cha, OFFY, Business Centrum Smíchov
  • International: IWG (Spaces + Regus), WeWork, mycowork Palmovka