Market Report H1 2026

We’re Entering a Healthier and More Mature Phase of the Real Estate Market

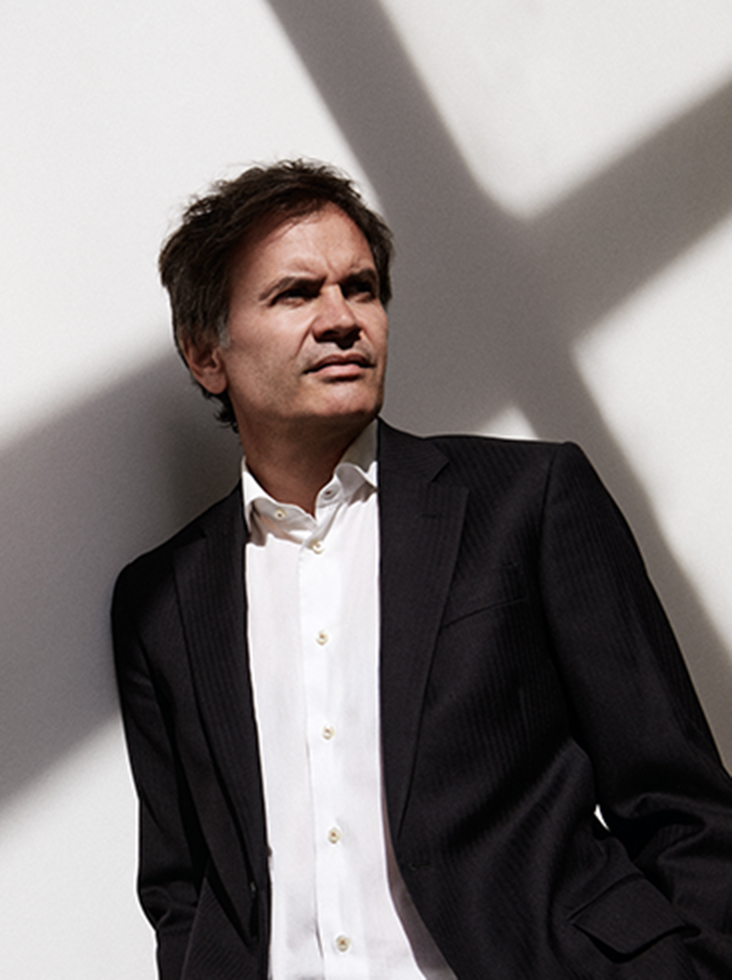
Prokop Svoboda

Owner of Svoboda & Williams

As summer begins, we’re once again bringing you our traditional analysis of the domestic premium real estate market for the past half-year. This time, the period in question was shaped by a number of variable and often conflicting factors.

The tense geopolitical situation in the Middle East, pressure on energy, labor, and construction material prices, and concerns about further inflation fluctuations have prompted real estate investors to be cautious, but also rational. Although interest in premium residential housing in the capital remains stable, buyers’ willingness to accept continued rapid price increases has reached its limit for the time being.

This trend was particularly evident in newly launched residential projects. Overly ambitious pricing expectations on the part of some developers almost never resulted in the desired status of exclusivity for their projects, but instead led to a noticeable decline in interest among potential clients. The premium property segment simply confirmed that quality is defined to a great extent by market realities.

One of the most significant developments in Prague’s real estate market in recent years was the recent approval of the Metropolitan Plan by Prague city councilors. The Prague Institute of Planning and Development anticipates that this long-awaited regulatory framework will unlock land within the city and create space for the construction of up to 350,000 apartments. Although an immediate construction boom is unlikely, Prague’s housing stock will undoubtedly increase significantly over the next decade. The question remains how quickly the urban market will absorb this new, generous volume of real estate.

Since the 1990s, real estate investments have been an attractive opportunity for generating high and stable returns. Today, the second generation of investors is building wealth by expanding their residential portfolios. The availability of cheap money and insufficient new housing construction guaranteed high profitability for speculative investment strategies. But these fundamentals can no longer be relied upon as they once were. In short, the days when anything and everything could be sold are over.

It will be very interesting to see how things develop from here. I believe we’re entering a healthy phase of a mature market, where only high-quality projects will succeed. And that is certainly good news for the market.

We hope you find our newest Market Report inspiring.

SAMPLE OF PROPERTIES MONITORED BY SVOBODA & WILLIAMS

1/2026–6/2026 vs. 7/2025–12/2025

  • CZK 191,924

    New builds and reconstructions, Ø per sq. m.

    Half-year change +2.8%

  • CZK 175,578

    Resales, Ø per sq. m.

    Half-year change +6.0%

  • CZK 43,627

    Average achieved rent for residential units per the Rental Price Index

    Half-year change +7.9%

  • DECREASE IN INQUIRIES

    Half-year change

    H1 2026 vs. H2 2025 −7.0%

TRENDS IN PRAGUE’S PREMIUM PROPERTY MARKET

Based on the sample monitored by Svoboda & Williams

Sales

Prague’s premium real estate market is going through a period that is testing the limits of its flexibility. 

Prices continue to rise. Over the past six months, they’ve increased by 3.6%, and by 7.4% in the year-on-year comparison. Nearly half of all sales transactions took place in the price range of CZK 160,000–200,000/m². A quarter (26%) of them were completed at prices above CZK 200,000/m². This trend confirms a structural upward shift in the Prague property market.

At the same time, however, we’re seeing a 7% decline in demand as well as weaker transaction activity in the market. This suggests a growing rigidity in prices, as sellers are factoring in high input costs or inflated expectations. 

The average transaction cycle for a premium apartment in Prague—from listing the asking price to closing the deal—currently stands at 150 days.

Looking ahead, the divergence we’re seeing in the market could perhaps lead to stagnation. 

For the second consecutive half-year, the proportion of transactions financed by mortgage loans (51% of buyers) has slightly exceeded the proportion of cash purchases in the sample under review.

After two years of continuous decline, we recorded a half-year-over-half-year increase in the average saleable area of the properties we sold. This was due to an increase in sales of large pre-owned apartments in the broader center of Prague.

Rentals

Both rental prices and the average size of the rented apartments in the sample we monitored rose significantly. However, the 7.9% increase in prices from one half-year to the next is more the result of several exceptional rental transactions than an indicator of a change in market dynamics. 

The average size of rental apartments also increased, this time by 12%. The rise in both the prices and sizes of rental properties is driven primarily by rental transactions in downtown Prague and the wider downtown area, where exclusive three-bedrooms units and larger ones predominate.

However, a 19% decline in demand in our half-year analysis and an almost identical decline in transaction activity indicate a market slowdown.

More than half (52%) of all lease agreements were signed in the broader city center, which has long served as the stable core of the rental market with the highest concentration of demand.

While demand among Czechs and foreigners is roughly equal, in terms of completed rental transactions, as many as 68% were concluded by foreigners.

Price Analysis

The Prague residential market through the lens of Svoboda & Williams during the monitored period 1/2026–6/2026. The analysis is based on actually achieved sales transaction values.

Methodology of Data Processing

The analysis is based on data obtained from the database of properties offered by Svoboda & Williams during the monitored period (January 2026–June 2026). Sales transactions were supplemented with data on sales of new builds with parameters that match Svoboda & Williams’ portfolio (in this case, the achieved prices were obtained from the Cadastre of Real Estate). The sample monitored by Svoboda & Williams contains nearly 250 sold and 500 rented properties over a 6-month period and therefore covers a significant portion of the premium segment of the Prague residential market. 

The monitored properties are apartments in Prague 1–10; other municipal districts are minimally represented. Within each district, most of the properties in the sample are in premium locations with higher achieved prices such as Bubeneč, Dejvice, Střešovice, and Břevnov in Prague 6, Pankrác, Vyšehrad, and Podolí in Prague 4, Karlín and parts of Libeň in Prague 8, Smíchov in Prague 5, etc. The monitored property prices and rents are actually achieved transactions; we don’t monitor advertised prices. To calculate the price per sq. m., we take into account the price for parking spaces, which we deduct from the achieved sales price and we also include a proportional part of the exterior (terraces, balconies, loggias, and gardens) in the floor area of the apartment (according to the Civil Code). To recalculate the exterior area, we apply a specially developed algorithm that progressively reduces this area and takes into account the ratio of the exterior to the interior area. Average prices are calculated from the transactions finalized over the last 6 months (1/2026–6/2026); percentage changes are half year (1/2026–6/2026 vs. 7/2025–12/2025). For sales, we also determine the price per sq. m. for two categories: new builds (new apartments in residential projects, completely reconstructed apartment buildings, or loft conversions) and resales (secondhand apartments). The prices of new apartments in residential developments are listed including VAT. In order to be able to compare the prices per sq. m. for all apartments, we unified the stage of construction progress for several units using an average assumption of CZK 50,000/sq. m. for the stage prior to reconstruction (shell & core) and CZK 20,000/sq. m. for the stage before the completion of surfaces (white walls). We don’t monitor the price per sq. m. for rentals. While the price per sq. m. is relevant for sales, for rentals the price is determined mainly by layout in addition to location. For example, a one-bedroom apartment with a 50 sq. m. floor area is normally rented for the same price as an apartment with the same layout with a floor area of 60 sq. m., whereas the purchase price of a larger apartment can be up to 15 to 20% higher. Therefore, in our analyses of residential rentals we work with the total rent, and not with the price per sq. m. For a better picture, we also state the achieved price for the most frequent layouts in the sales and rental transactions realized by Svoboda & Williams, i.e., one-bedroom and two-bedroom apartments. 

Data analysis

Methodology of Svoboda & Williams

Ne

Listed price

Ano

Achieved price

Price per sq. m =
Achieved sales price - price of parking Apartment area + proportional part of the exterior (b/t/g)

Algorithm for conversion of the exterior

The area of a terrace that exceeds 30% of the interior is divided by two.

The analysis is based on data obtained from the database of properties offered by Svoboda & Williams in the monitored period. We supplement the sales transactions with sales data from the land register with similar parameters to our sample. We monitor the value of achieved transactions, not offer prices.

The selected methodology is one of the most precise analytical tools on the market. To calculate the price per sq. m., we take into account the ratio of the exterior to the interior, the standard of the property's facilities, and the price for parking is deducted from the achieved sales price. Additional information can be found in the Data Processing Methodology section.

OVERALL SUMMARY

during the monitored period 1/2026–6/2026

Average prices during the monitored period (1/2026–6/2026) and their half-year change (compared to 7/2025–12/2025)

Ø Apt. price* Ø Price per sq. m. Ø Apt. size Ø Price per sq. m.
New apt.** Resale apt.
Sales CZK 14,612,596 CZK 183,973 78.2 sq. m. CZK 191,924 CZK 175,578
7.9% 3.6% 2.5% 2.8% 6.0%
Rentals CZK 43,627 N/A 94.6 sq. m. N/A N/A
7.9% N/A 12.4% N/A N/A

Source: data of Svoboda & Williams | *all layouts | **new builds and reconstructions

Average achieved rents vs. sales prices for specific layouts in Prague 1–10 in the monitored period (1/2026–6/2026)

Layout Ø Monthly rent Rentals Ø apt. floor space Ø Selling price Sales Ø apt. floor space
studio CZK 23,335 39.2 sq. m. CZK 6,856,477 34.7 sq. m.
1bdrm CZK 30,862 60.4 sq. m. CZK 11,053,075 61.1 sq. m.
2bdrm CZK 44,906 103.3 sq. m. CZK 17,308,829 97.6 sq. m.
3bdrm CZK 72,188 147.0 sq. m. CZK 24,303,186 130.9 sq. m.
4bdrm CZK 84,912 187.4 sq. m. CZK 40,353,978 195.8 sq. m.

Source: data of Svoboda & Williams

SALE

Overview of the average sales prices achieved in each city district during the monitored period (January 2026–June 2026)

Municipal district Ø Apt. price Ø Price per sq. m. Ø Apt. size
Prague 1 CZK 15,777,694 CZK 215,398 73.2 sq. m.
Prague 2 CZK 13,803,839 CZK 189,415 72.9 sq. m.
Prague 3 CZK 12,833,455 CZK 172,095 74.6 sq. m.
Prague 4 CZK 14,449,844 CZK 179,643 80.4 sq. m.
Prague 5 CZK 11,212,608 CZK 158,054 70.9 sq. m.
Prague 6 CZK 12,929,994 CZK 160,878 80.4 sq. m.
Prague 7 CZK 24,029,236 CZK 175,762 137.0 sq. m.
Prague 8 CZK 17,385,946 CZK 201,710 86.2 sq. m.
Prague 9 CZK 10,170,649 CZK 149,588 68.0 sq. m.
Prague 10 CZK 9,404,310 CZK 181,155 51.9 sq. m.

Source: data of Svoboda & Williams

Development of the average achieved sales price per sq. m. in the segment monitored by Svoboda & Williams (in CZK)

Buyer Segmentation

Ratio of Czech and foreign buyers

77% Czechs
23% Foreigners

Financing the purchase of property

49% Own funds
51% Mortgage loans

Sales per layout

7.0% studio
52.6% 1bdrm
34.2% 2bdrm
1.8% 3bdrm
4.4% 4bdrm and larger

RENTALS

Overall summary of average achieved rental prices in municipal districts (1/2026–6/2026)

Municipal district Ø Monthly rent Ø Apt. floor space Ø Monthly rent 1bdrm Ø Monthly rent 2bdrm
Prague 1 CZK 51,267 102.3 sq. m. CZK 36,279 CZK 56,655
Prague 2 CZK 50,056 104.9 sq. m. CZK 32,559 CZK 45,902
Prague 3 CZK 38,446 79.6 sq. m. CZK 27,430 CZK 36,657
Prague 4 CZK 36,318 84.5 sq. m. CZK 27,785 CZK 38,671
Prague 5 CZK 46,933 102.9 sq. m. CZK 29,693 CZK 43,118
Prague 6 CZK 50,190 106.7 sq. m. CZK 33,558 CZK 44,955
Prague 7 CZK 37,165 89.5 sq. m. CZK 27,700 CZK 41,563
Prague 8 CZK 40,390 67.3 sq. m. CZK 32,332 CZK 49,900
Prague 9 CZK 31,417 93.0 sq. m. CZK 24,250 CZK 35,500
Prague 10 CZK 40,612 94.5 sq. m. CZK 27,690 CZK 40,278

Source: data of Svoboda & Williams

Tenant Segmentation

Ratio of Czech and foreign clients inquiring about a property

50% Czechs
50% Foreigners

Ratio of clients who rented a property

32% Czechs
68% Foreigners

Rents per layout

6.9% studio
37.0% 1bdrm
35.9% 2bdrm
14.9% 3bdrm
5.3% 4bdrm and larger

Overview of rental price segments–rental inquiries vs. realised rental transactions

Price segments Inquiries - Czechs Inquiries - Foreigners Realized rental transactions - Czechs Realized rental transactions - Foreigners
< CZK 30 thous. 48% 52% 38% 62%
CZK 30-60 thous. 50% 50% 32% 68%
> CZK 60 thous. 52% 48% 22% 78%
Total 50% 50% 32% 68%

Source: data of Svoboda & Williams

Rental price index

An analytical tool developed in cooperation with the University of Economics in Prague that provides a more detailed view of the change in the prices.

METHODOLOGY OF DATA PROCESSING

WHAT IS THE RENTAL PRICE INDEX BY SVOBODA & WILLIAMS + VŠE?

The Rental Price Index by S&W + VŠE is an analytical tool that monitors the growth of rental prices in the premium segment in Prague developed by the Svoboda & Williams real estate agency in cooperation with the Faculty of Informatics and Statistics of the University of Economics in Prague. The data is sourced from the actually achieved rents of the apartments that were listed by Svoboda & Williams. Annually, it amounts to 1,200 properties in the territory of Prague 1–10 with studio to 5-bedroom layouts. Since the properties exhibit a high level heterogeneity, we apply an aggregate price index to the development of their prices. It works just like the Consumer Price Index maintained by the Czech Statistical Office, which measures inflation.


WHY SIMPLY COMPARING THE AVERAGE PRICE DEVELOPMENT IS NOT ENOUGH?

The development of average rental prices doesn’t correctly reflect the actual change in prices. This is because the average rent is influenced not only by fluctuations in prices, but also by a changed product structure. Let’s give an example. In two monitored periods, a sample of apartments including luxury apartments in the center of Prague and cheaper apartments in the broader center have been rented. The prices of both the cheaper and the luxury apartments in the second period remain equal, but more of the expensive units have been rented. This will raise average rents, but the price index will remain the same. The aggregate price index is based on the assumption of the fixed presence of rental segments in the portfolio and therefore reflects the change in price, which is “cleaned” of the change in the rental structure. The index is calculated as a weighted average of the price changes in the individual segments, where the weights are their representation in the portfolio (structure) in the selected fixed period.


CONSTRUCTION OF THE RENTAL PRICE INDEX BY SVOBODA & WILLIAMS + VŠE


Selection of segments

The segmentation made sure that the apartments in the same group were as similar as possible and, on the other hand, that the groups were as different as possible. At the same time, each group had to contain a sufficient amount of data. Within the statistical analysis, the impact of many factors on rental prices was examined. These parameters included the specific layout of an apartment, its location, floor, and whether it came with a terrace, balcony, or loggia, or the option to rent a parking space. The analysis proved that rents were most affected by the location and layout of the apartment, and therefore we performed the segmentation based on these two factors.

Based on our expertise and the data analysis of rental prices, we divided Prague into three locations—the center, the wider center, and the rest of Prague (see map above).

Apartment layouts were chosen as the second factor. Based on the location and the layout we defined 9 segments in total: studio to one-bedroom, two-bedroom, and three-bedroom and larger in the Center, Wider center, and Rest of Prague.


Selection of weights

We assigned weights to the individual segments on the basis of the structure of the apartments rented during the calendar year of 2016. The weight of a segment in the price index is calculated as a proportion of the total rent in the relevant segment to the total rent for all segments brokered in 2016. 

The index is compiled on a biannual basis to ensure that a sufficient number of observations could be made. In practice, biannual indexes aren’t as common as monthly or quarterly indexes, but they’re by no means exceptional. For example, the United States Department of Labor uses one to construct the consumer price index.


We calculate two kinds of indexes

A year-on-year index  – monitors the rental price changes between the current half-year period and the previous half-year period (e.g. H1 2025 vs. H2 2024)

A base index – monitors the rental price changes between the current and the so-called base period. A stable period considered a long-term “normal” default should be selected as a base period, in our case H1 2015.

The source of the data is the actual rental prices achieved by Svoboda & Williams, constituting approximately 1,200 properties per year in Prague 1–10 with layouts ranging from studios to 5-bedrooms. Since these prices vary widely, we apply an aggregate price index to their development over time. It works similarly to the consumer price index of the Czech Statistical Office.

ACHIEVED RENTS FOR PREMIUM APARTMENTS IN PRAGUE

H1 2026 (January 2026–June 2026)

CZK 43,627

Average achieved rents in the monitored period (January 2026–June 2026) in Prague

+7.9%

Change in the semi-annual index compared to the previous period (July 2025–December 2025)

The Basic Aggregate Price index tracks changes in the average achieved rental price for apartments in Prague from Svoboda & Williams' listings during the monitored period (January 2026–June 2026) compared to the base period, which is set as the first half of 2015. It's an aggregate price index calculated as a weighted average of changes in rents for individual categories of apartments.

Development of achieved rents for apartments in the segment monitored by Svoboda & Williams (2015 H1 = 100).

Achieved apartment rents in H1 2026 per segment and half-year changes

Segment Center Wider center Rest of Prague
Studio to 1bdrm CZK 33,372 −1.2% CZK 28,903 1.8% CZK 27,017 10.8%
2bdrm CZK 48,433 −3.7% CZK 44,327 −5.8% CZK 37,282 7.4%
3bdrm and larger CZK 97,944 22.4% CZK 69,609 −6.9% CZK 57,846 3.4%

Source: data of Svoboda & Williams

Relative representation in the portfolio

Segment Center Wider center Rest of Prague
Studio to 1bdrm 9.8% 24.7% 9.8%
2bdrm 12.5% 15.7% 7.6%
3bdrm and larger 4.3% 12.2% 3.5%

Note: Apartments with 6-bedroom layouts and larger are represented too sparsely and are not included in the analysis.

Prague 1 Prague 2 Prague 6 Prague 5 Prague 4 Prague 3 Prague 7 Prague 8 Prague 9 Prague 10
  • Center
  • Wider center
  • Rest of Prague

Prague Office Market

H1 2026

Current trends in the commercial leasing market

3.93 mil. sq. m.

Total volume of office space in Prague

5.8%

Vacancy rate

EUR 30/sq. m./month

Prime rent in the city center

A key factor in the Prague office market is the high demand for high-quality Class A space in central locations. Supply has consistently failed to keep pace with demand, and so quality office space is slowly disappearing from the market. In the best buildings in the most sought-after locations, such as Karlín and Pankrác, occupancy rates often exceed 95%. Overall, occupancy rates for Class A office buildings hover around 70%. Therefore, rents in the premium segment will likely continue to rise.

During the first quarter, construction began on three new office projects: Sequoia in Prague 4 (33,000 m2), Churchill III in Prague 2 (20,800 m²), and Dvory Vysočany in Prague 9 (6,000 m2). Currently, over 312,000 m² of office space is under construction, three-quarters of which are already pre-leased or being built by companies for their own use (new headquarters of ČEZ, Erste, or Creditas). This year, only 36,700 m² of new or renovated office space will be completed.

For those interested in new, high-quality spaces, inaction or indecision are becoming unsustainable strategies—the market in 2026 favors quick decision-making. This year, Svoboda & Williams expanded its services to include the negotiation of subleases of furnished and equipped premises offered by major shared office operators. This is an increasingly attractive option for securing suitable spaces quickly and with minimal upfront investment. In Prague today, the largest operators can flexibly partition off even standalone units measuring several hundred square meters, while retaining the benefits of each operator’s service portfolio.

Jaroslav Waldhauser 
Head of Office Leasing Svoboda & Williams

Source: data of Prague Research Forum

TOTAL VOLUME OF FLEXIBLE OFFICE SPACE IN PRAGUE

143,480 sq. m.

The first half of 2026 saw the stabilization of Prague’s flexible office market. The segment is gradually shifting from a phase of dynamic growth to a more mature state of consolidation. The total floor area of flexible office space remains roughly at 144,000 m².

Growth today is driven more by expansion and the optimization of existing locations than by the entry of new players. Commercial property operators are therefore focusing more on stable occupancy rates, the quality of their services, and the long-term sustainability of their portfolios, and less on rapid expansion. Key developments included the opening of Scott.Weber Workspace’s new location PernerKarlín with a total area of 3,991 m² and capacity of 531 workstations. The occupancy rate reached 70% prior to the opening.

WorkLounge continued to strengthen its existing portfolio. In Pankrác, they added a new 700 m² floor and in Telehouse in Dejvice they increased the number of offices they serve by adding a further 400 m². Instead of expanding into new buildings, the company is focusing on developing and improving its existing centers and on what it can offer to larger clients. Regus continued its trend of regional expansion with the opening of the new Regus D1 Říčany location, confirming the growing importance of flexible office spaces even outside the narrow center of Prague.

The limited supply of new office projects in Prague, combined with high occupancy rates in the traditional market, is driving demand for flexible solutions, which have firmly established themselves in Prague as a stable and integral part of the office market. 

At the same time, there is a growing shift in how office spaces are perceived. They are no longer just an expense, but a tool to help productivity, corporate culture, and the ability to attract and retain talent. Face-to-face meetings, community, and an inspiring environment naturally foster networking and the sharing of experiences—aspects that cannot be fully replaced by a hybrid work model. As a result, the office is increasingly becoming a place that forges collaboration, team energy, and relationships within companies.

PRAGUE'S SHARED OFFICE MARKET

Percent of operators' market share

CELKOVÝ OBJEM FLEXIBILNÍCH KANCELÁŘSKÝCH PLOCH V PRAZE

  • Local: Offices Unlimited, Scott.Weber Workspace, Fleksi, Flexi Offices, Impact Hub, Opero, WorkLounge, Mo-Cha, Zenwork, Business Centrum Smíchov
  • International: IWG (Spaces + Regus), WeWork, mycowork Palmovka